Benchmarking spatial and single-cell transcriptomics integration methods for transcript distribution prediction and cell type deconvolution
Benchmarking spatial and single-cell transcriptomics integration methods for transcript distribution prediction and cell type deconvolution
Abstract
Spatial transcriptomics approaches have substantially advanced our capacity to detect the spatial distribution of RNA transcripts in tissues, yet it remains challenging to characterize whole-transcriptome-level data for single cells in space. Addressing this need, researchers have developed integration methods to combine spatial transcriptomic data with single-cell RNA-seq data to predict the spatial distribution of undetected transcripts and/or perform cell type deconvolution of spots in histological sections. However, to date, no independent studies have comparatively analyzed these integration methods to benchmark their performance. Here we present benchmarking of 16 integration methods using 45 paired datasets (comprising both spatial transcriptomics and scRNA-seq data) and 32 simulated datasets. We found that Tangram, gimVI, and SpaGE outperformed other integration methods for predicting the spatial distribution of RNA transcripts, whereas Cell2location, SpatialDWLS, and RCTD are the top-performing methods for the cell type deconvolution of spots. We provide a benchmark pipeline to help researchers select optimal integration methods to process their datasets.
Results
Figure1
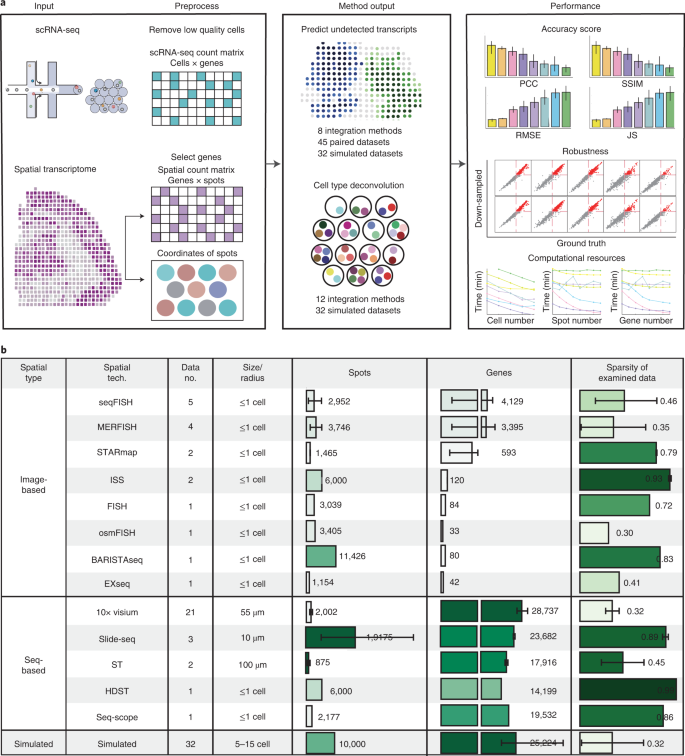
Figure1 shows benchmarking workflow and summary characteristics of the examined paired datasets.
Figure2
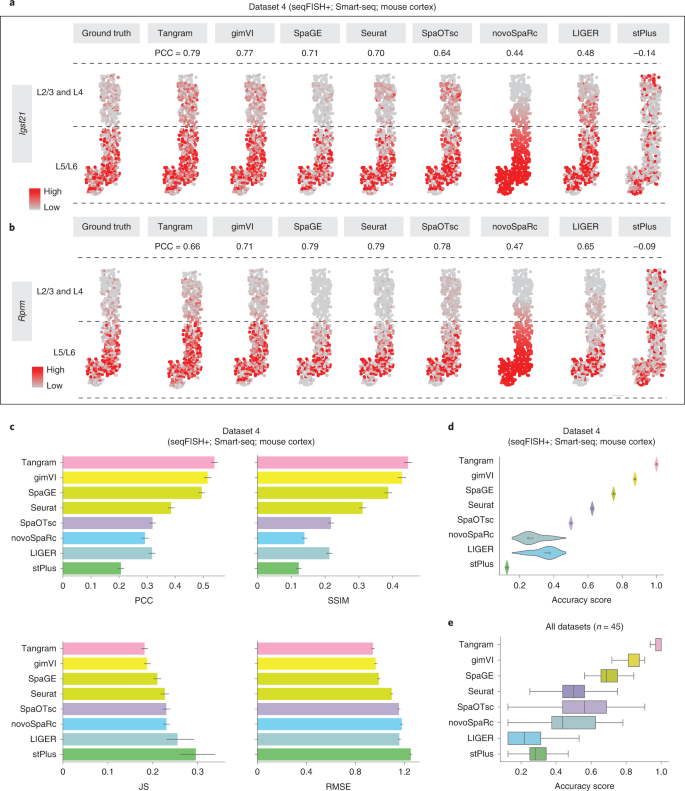
Figure2 shows how to compare the predicting result of integration method and the real result through different arguments.
“(1) structural similarity index (SSIM), which combines mean value, variance, and covariance to measure the similarity between the predicted result and the ground truth; (2) root mean square error (RMSE), the absolute error between the predicted distribution and the ground truth; and (3) Jensen–Shannon divergence (JS), which uses relative information entropy to gauge the difference between two distributions.” (Li 等, 2022, p. 663)
“For one gene, a higher PCC/SSIM or lower RMSE/JS value indicates better prediction accuracy. We also defined an accuracy score (AS) by aggregating the four metrics (Methods) to simplify the evaluation of the accuracy of each integration method (a higher AS value indicates better performance).” (Li 等, 2022, p. 663)
Figure3
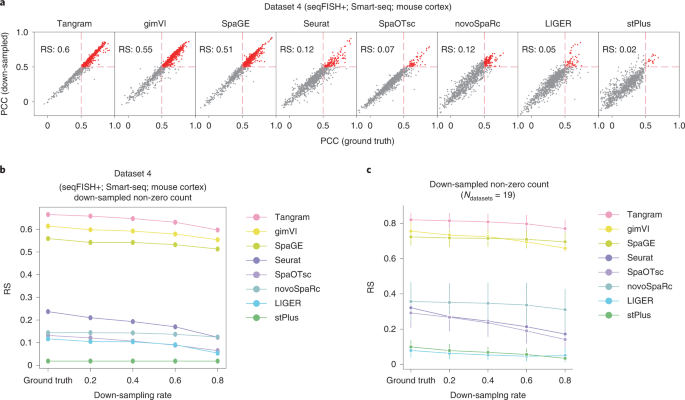
Figure3 compares the accuracy of the eight integration methods for sparse spatial expression matrices down-sampled from the original datasets.
Plot a shows the PCC scores of the spatial distribution of transcripts predicted from the original data and down-sampled data from dataset 4. The PCC values of the red-colored transcripts are greater than 0.5 for both the original and the down-sampled data.
Figure4
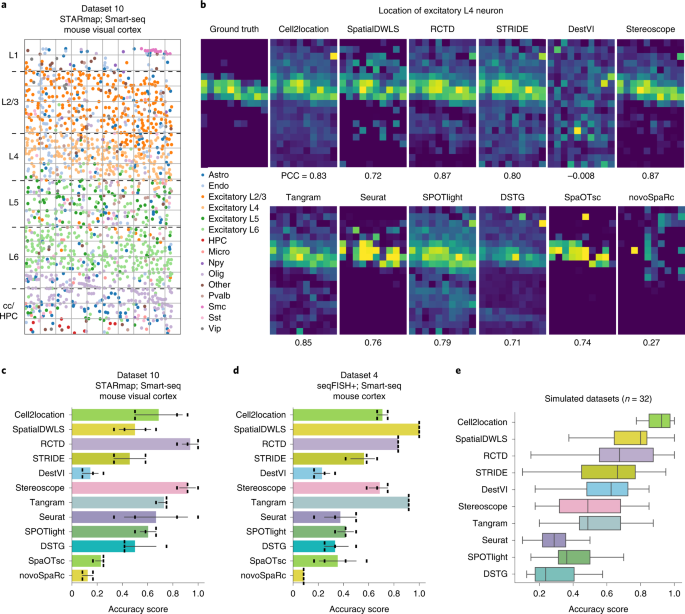
Figure4 compares the performance of the 12 integration methods capable of deconvoluting cell types of each histological spot.