Gitto
- 1、coherent gene expression
- 2、spatial domain detection
- 3、spatial variable genes
- 4、cell-cell communication
- Reference
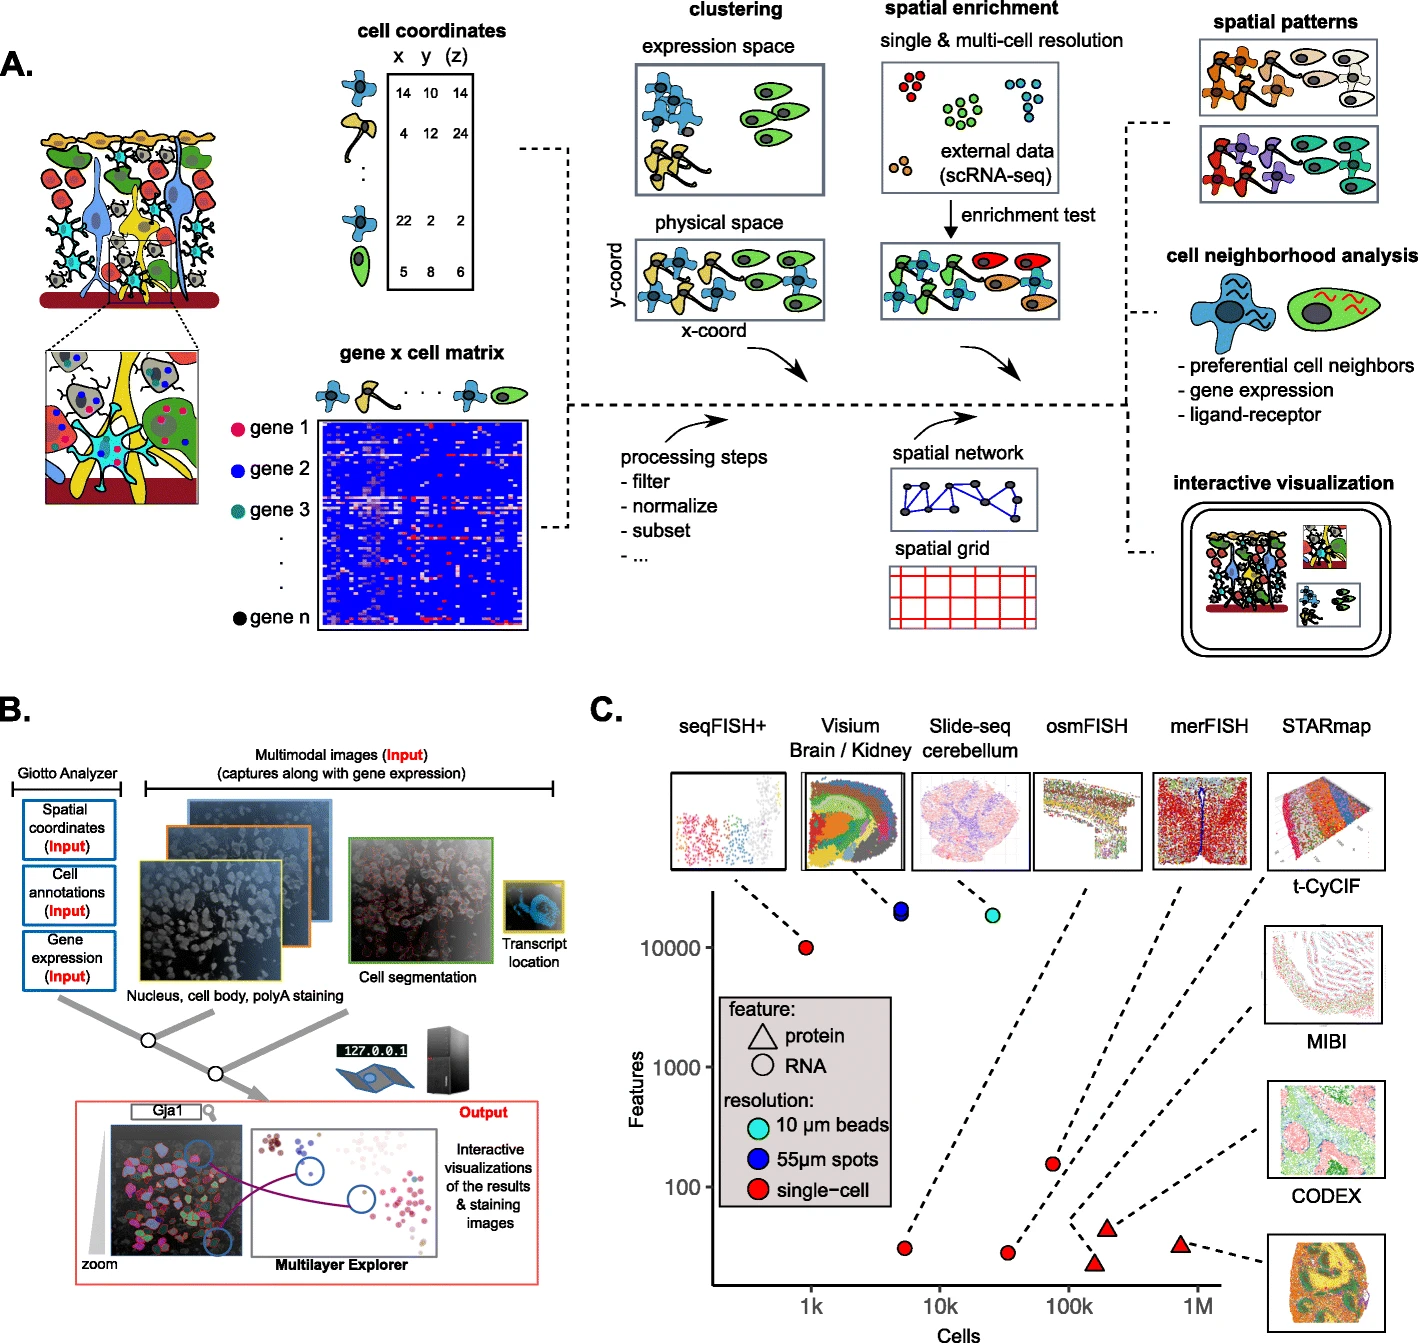
Recently, I read a toolbox Giotto to characterize spatial transcriptomics data. It focus on three parts: 1) characterizing tissue composition; 2) spatial expression patterns; 3) cellular interactions.
In this literature, what interests me lost is these three aspects.
1、coherent gene expression
In Giotto, it depends on two functions detectSpatialCorGenes and clusterSpatialCorGenes. The first function spatially smooths gene expression through a grid averaging or k-nearest neighbor approach and then calculates the gene-to-gene correlation (default = Pearson) scores. The second function performs hierarchical clustering to cluster the gene-to-gene co-expression network into modules and creates metagene scores by averaging all the genes for each identified co-expression module
For my perspective, I don't approve the genes found by this method are belong to gene co-expression relationship. I think they just have gene expression correlation.
2、spatial domain detection
Firstly, HMRF infers the state of each cell as the joint probability of the cell’s intrinsic state (inferred from the cell’s own gene expression vector), and the cell’s extrinsic state, which is based on the distribution of the states of the cell’s neighbors.
The neighborhood graph defines the extent of the neighbor cell influence, together with the parameter beta that defines the strength of the interaction of cells.
At the end, HMRF assigns each cell to one of k spatial domains (k to be defined by the user).
3、spatial variable genes
For SVGs, the toolbox integrate methods such like SpatialDE, SPARK, Trendsceek and BinSpect.
4、cell-cell communication
This is implemented in the function spatCellCellcom.
\(\overline{S(L, R, A, B)}=\frac{1}{n} \sum_{i=1}^n L_i+\frac{1}{m} \sum_{j=1}^m R_j\)
where \(n\) represents the number of A-type cells that interact with B-type cells, \(m\) represents the number of B-type cells that interact with A-type cells, \(L_{i}\) represents the expression level of the ligand in the ith A-type cell, and \(R_{j}\) represents the expression level of the receptor in the jth B-type cell.
And how to do the statistic test?
This background distribution is created by shuffling cell locations within the same cell type for A and B for 1000 (= default) times. In each round, a permutation score Sp is calculated using the same formula. Associated p values were calculated as the probability of Sp to be greater or smaller than the actual observed score S.Thep values for all ligand-receptor pairs in all cell-type pairs were subsequently adjusted for multiple hypothesis testing.
Reference
- [1] Giotto