Hotspot
Hotspot is a useful tools to find gene expression module, especially in tumor spatial transcriptome.
Now, I want to introduce its work principle.
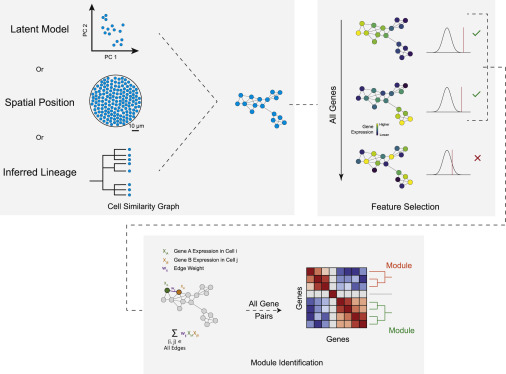
To compute gene modules, Hotspot uses a three-step procedure:
1、Find informative genes with high local autocorrelation
Firstly, to compute cells similarity map through KNN graph or spatial position or development lineage.
For an interested gene \(x\), to calculate its \(H_x\). \[ H_x=\sum_j \sum_{j \neq i} w_{i j} x_i x_j \] If cell \(i\) and cell \(j\) are nearest neighbors, then weight \(w_{ij}\) is higher then dissimilar cells. If cell \(i\) and cell \(j\) are denifitely different, then weight \(w_{ij}\) is equal to 0.
\(x_i\) and \(x_j\) are gene \(x\) expression value in cell \(i\) and cell \(j\) . Notably, whether \(x_i\) or \(x_j\) is standardized expression value (such that \[ E\left[x_i\right]=0\],\[ E\left[x_i^2\right]=1 \]).
But, how to evaluate \(H_x\) and detect informative genes?
For each gene, to define a null model in which the expression values are drawn independently from some assumed distribution and transfer \(H_x\) to Z-score to eveluate statistically significant. \[ \hat{Z}=\frac{\widehat{H}-\mathrm{E}[\hat{H}]}{\operatorname{var}(\widehat{H})^{\frac{1}{2}}}=\frac{\sum_i \sum_j w_{i j} \widehat{X_i} \widehat{X}_j}{\left(\sum_i \sum_j w_{i j}^2\right)^{\frac{1}{2}}} \] Through this formula, the method measures cell’s expression by its local neighborhood in the graph. Finally, \(\hat{Z}\) represents gene expression value.
2、Evaluate pair-wise local correlations between genes
In the first step, we can identify informative genes. \[ H_{x y}=\sum_i \sum_{j \neq i} w_{i j}\left(x_i y_j+y_i x_j\right) \] Here, the \(i\), \(j\) indices represent individual cells and \(x_i\) and \(y_i\) are the standardized expression values in cell \(i\) for genes \(x\) and \(y\), respectively. Weights \(w_{ij}\) are defined as before based on the cell similarity map. As with \(H_{x}\), the null model is again used to convert \(H_{xy}\) values into \(Z\) scores. \[ \mathrm{E}\left[H_{x y}^2\right]=\sum_i^N\left(\sum_{j \in N(i)} w_{i j} \hat{x}_j\right)^2 \]
3、Cluster the resulting gene-gene affinity matrix
Through applying a bottom-up clustering procedure with two parameters min_cluster_genes, and fdr_threshold to cluster these genes into module.
If a module accumulates more than min_cluster_genes, then it is assigned a label.
The fdr_threshold parameter is used to set a minimum significant Z-score. If at any point in the above merging module procedure the maximal Z-score falls below this threshold, the procedure halts as further gene assignments fall below the significance threshold and are therefore ambiguous.